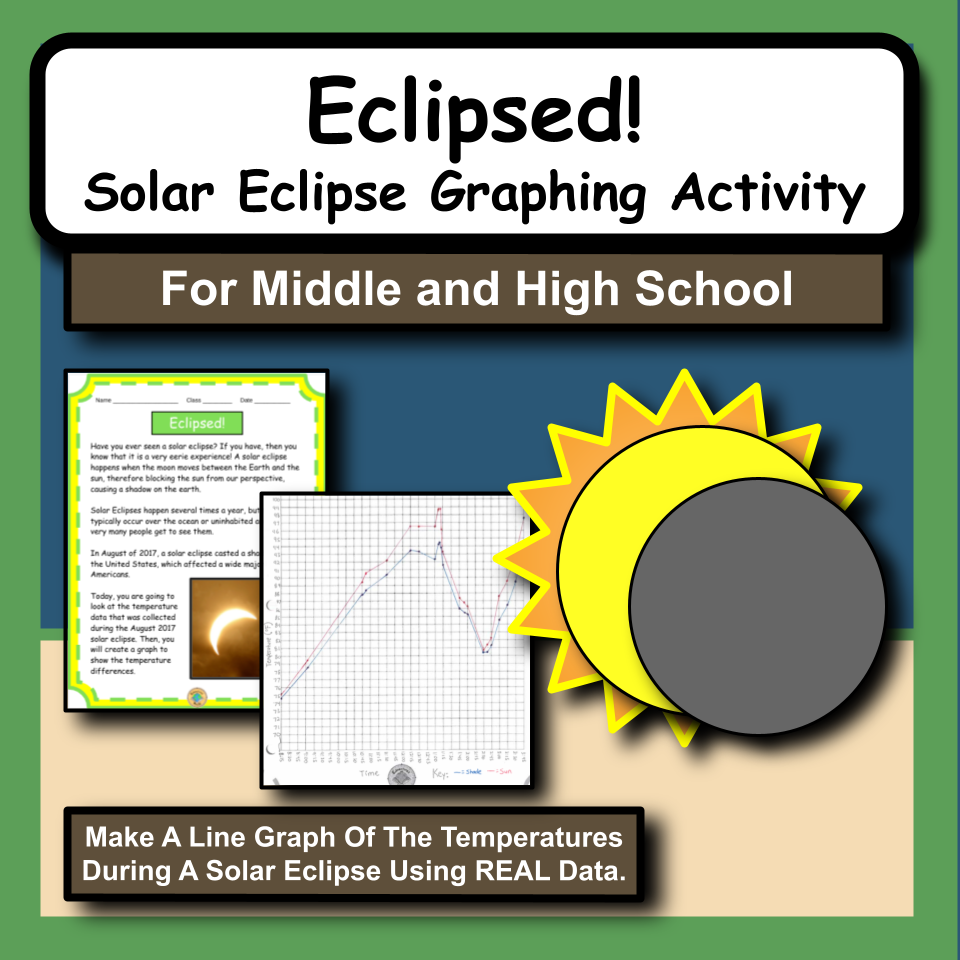
Eclipsed! Solar Eclipse Graphing Activity
For Middle and High School
$2.25$2.00
Experience the wonders of space with the 'Eclipsed! Solar Eclipse Graphing Activity.' This engaging and educational activity empowers students to chart temperature changes during a solar eclipse with authentic, real-world data. Ideal for hands-on learning, this activity not only teaches scientific concepts but also enhances data analysis skills.
Students love learning about natural phenomenons! This activity includes REAL temperature data gathered during the August 2017 solar eclipse. The temperatures were recorded throughout the day in two locations: one location in the shade and another location in the sun.
I typically use this activity with middle school and high school when we talk about solar eclipses or Earth and Space Science.
Students will read a data table with recorded shade and sun temperatures. Then, they will make a double line graph (one line for the shade temperatures and one for the sun temperatures). Finally, they will analyze their data and answer questions about what they learned.
This product includes:
Teacher Directions-including prep info and materials needed
Teacher procedure
Student Packet-Short reading, data table, student blank graph, analysis questions
Student Packet Answers
Graph Answer
Teacher Tips
To do this activity, students will need:
Pencil
Copy of “Eclipsed!” packet for each student (provided)
Optional: Two different colored pencils or pens
Optional: Ruler/straight edge
Join my email list here to learn about ways to encourage students to experience the content!
You can also follow me on Pinterest, Instagram, Facebook and YouTube!
If you have any questions, feel free to email me at edventureswithmrsd@gmail.com.
Thank you!
5th-10th Grade
Earth Science
General Science
Astronomy
10 Pages
"Great resource to integrate Science and Math!" Cathy Z.