Everglades National Park: Water Levels Graph Activity
For Middle and High School
$3.00$2.00
Dive into the world of data analysis with our Everglades National Park Water Levels Graph! Perfect for students and educators, this engaging resource lets you track and visualize water levels throughout the year in the Everglades. With detailed data sets and dynamic graphing activities, it’s an excellent tool to enrich learning and spark curiosity. Ideal for classrooms, homeschool, science projects, or individual study, don't miss out on an educational adventure that brings the science of the Everglades to your fingertips!
Everglades National Park is a unique ecosystem with hundreds of species of animals that dwell in its waters. The water levels throughout the Everglades can vary throughout the year and it supports the organisms that live there.
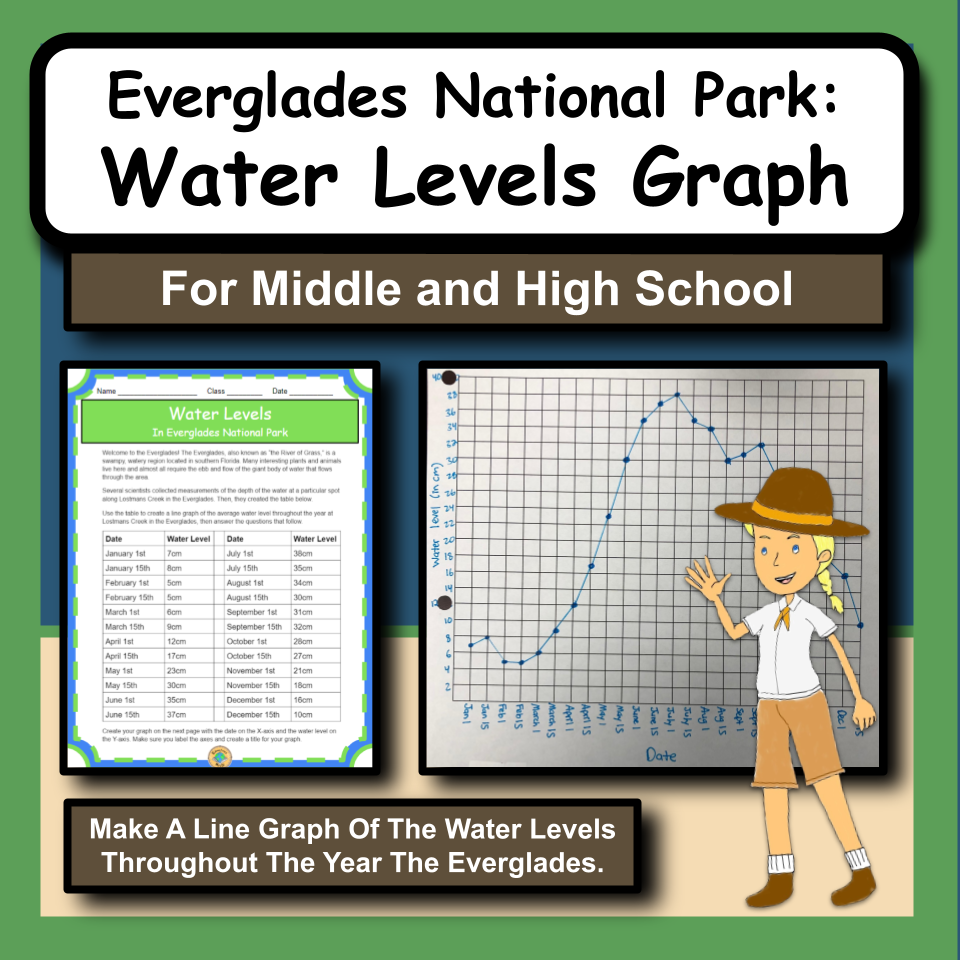
In this activity, students will learn how to make a line graph and then they will answer questions about the graph they created.
Students will look at a table that has 24 measurements of water levels in a particular area in the Everglades throughout the year (two measurements per month).
They will use this information to create a line graph, depicting the change in water levels throughout the year.
Finally, they will answer 10 analysis questions about the graph they made, including determining the wet/dry season, finding averages and differences, etc.
This activity gives students an opportunity to learn about the Everglades as they graph the water levels throughout the year.
This product includes:
Teacher Directions-including prep info and materials needed
Teacher procedure
Student Packet-Short reading, data table, student blank graph, analysis questions
Student Packet Answers
Graph Answer
Teacher Tips
To do this activity, students will need:
Pencil
Copy of “Everglades Water Levels” packet (INCLUDED) for each student
Optional: Calculator
Optional: Ruler/straight edge
Also, check out my Youtube Channel for FREE informational videos about the national parks along with FREE video guides for your students!
Join my email list here to learn about ways to encourage students to experience the content!
You can also follow me on Pinterest, Instagram, Facebook and YouTube!
If you have any questions, feel free to email me at edventureswithmrsd@gmail.com.
Thank you!
6th-12th
Science
Water Levels
Graphing
General Science
National Parks
Math
9 Pages
"Loved this activity. The kids thought it was really fun to make something hands on." Kayla B.
"Used this with my gifted fourth graders. It was nice to have a hands-on activity to go with the park. Highly recommend!" H.H.
"This was an excellent resource to supplement my curriculum!" Brandy B.